Thursday, July 2, 2015

Blog name change notification

Dear Readers,

I'll be switching to orabliss.blogspot.com from next week. As of now the blog contains nothing but the notification message alone.
Please make a note of it and follow me there for updates. An automatic redirection for all the posts will be provided from this blog's content even if you land on this blog (oraclemamukutti.blogspot.com) for an initial few days and I will discontinue this blog. 
Please provide your support in my new blog as well.

Thanks!

Wednesday, January 7, 2015

Total used space of a table

The total used space of a table should be calculated by using the summation of sizes of the table's segment, it's indexes segment and the segment sizes of the lob and lobindexes associated with it. This can be achieved by the below script which calculates the size of all the tables that belongs to a particular schema and lists from the biggest to the smallest.

SQL> 
select * from 
( 
SELECT owner, table_name, sum(bytes)/1024/1024 MB 
FROM 
(SELECT segment_name table_name, owner, bytes 
FROM dba_segments 
WHERE segment_type in ('TABLE','TABLE PARTITION','TABLE SUBPARTITION') 
UNION ALL 
SELECT i.table_name, i.owner, s.bytes 
FROM dba_indexes i, dba_segments s 
WHERE s.segment_name = i.index_name 
AND s.owner = i.owner 
AND s.segment_type in ('INDEX','INDEX PARTITION','INDEX SUBPARTITION') 
UNION ALL 
SELECT l.table_name, l.owner, s.bytes 
FROM dba_lobs l, dba_segments s 
WHERE s.segment_name = l.segment_name 
AND s.owner = l.owner 
AND s.segment_type = 'LOBSEGMENT' 
UNION ALL 
SELECT l.table_name, l.owner, s.bytes 
FROM dba_lobs l, dba_segments s 
WHERE s.segment_name = l.index_name 
AND s.owner = l.owner 
AND s.segment_type = 'LOBINDEX') 
WHERE owner in UPPER('OWNER') 
GROUP BY table_name, owner 
order by mb desc) 
; 

Update: 22-Jan-2015
Query handles partitioned tables and IOT as well. IOT segments are listed as separate tables. It should be mapped accordingly to the IOT tables.

Source: Various sites and Forums.

Thursday, June 12, 2014

SETTING NLS_ENV FOR DBMS_JOBS

Today, 10 days after migrating the database from Oracle 9i (9.2.0.7) to Oracle 11gR2 (11.2.0.4), we experienced a serious issue (when one of the colleague found  the issue when analysing the data) that the current production data were missing from the database. Immediately we got into business to find out the cause of the data loss and to fix it.

Steps took to find the  root cause.


  • Does someone login to the database and delete the records accidentally? Do we have audit enabled?
  • Does the data were properly loaded in the database during migration as we used normal export/import as our migration tool due to the size of data involved?
  • Consider usage of log miner to find the statements that were deleting the data.
  • Is there any job scheduled via cron or DBMS_JOBS that deletes data?
We don't have auditing enabled in the database, so it becomes difficult to check the login details. We went through all the export and import logs to verify whether all the required objects and their data were loaded correctly and yes they were perfect. We also checked for cron entries and jobs scheduled in the database. Before we get into digging the logminer, we found that there was a job scheduled to delete the old data which were not required and older than 38 days.

Now the question is if the job deletes the data which were set a flag as not required and older than 38 days, do we have to really care for the missing data? Is the data being deleted to be restored again? Yes, the data being deleted is not 38 days older and they are not set a flag as not required. Data older than 2 days which were important data has been deleted.

Again, then what is causing the issue here? We were confused on what is going in the database.
As the database is migrated just 10 days back, we didn't shut down the legacy database completely and it was kept open for reference purpose. So I took a look at the job that is calling a procedure to delete data older than 38 days and compared it with the legacy database. Everything looks fine. They were calling the same procedure in both the environment and the procedures were identical in every respect.
Taking a deep look in the jobs with querying the dba_jobs, I got the clue.

SQL> select job, LOG_USER,PRIV_USER,SCHEMA_USER,LAST_DATE,LAST_SEC,FAILURES,WHAT,NLS_ENV from  dba_jobs;
       JOB LOG_USER        PRIV_USER       SCHEMA_USER                    LAST_DATE LAST_SEC   FAILURES WHAT
---------- --------------- --------------- ------------------------------ --------- -------- ---------- ----------------------------------------
NLS_ENV
--------------------------------------------------------------------------------------------------------------------------------------------------------------------------------------------------------------------------------------------------------------------------------------------------------------------------------------------------------------------------------------------------------------------------------------------------------------------------------------------------------------------
         3 USER1    USER1    USER1                   12-JUN-14 04:00:00          0 Proc_Cleandata_Close38days( );
NLS_LANGUAGE='AMERICAN' NLS_TERRITORY='AMERICA' NLS_CURRENCY='$' NLS_ISO_CURRENCY='AMERICA' NLS_NUMERIC_CHARACTERS='.,' NLS_DATE_FORMAT='DD-MON-RR' NLS_DATE_LANGUAGE='AMERICAN' NLS_SORT='BINARY'

The same job when queried from the legacy database gave the following output.

SQL> select job, LOG_USER,PRIV_USER,SCHEMA_USER,LAST_DATE,LAST_SEC,FAILURES,WHAT,NLS_ENV from  dba_jobs;
       JOB LOG_USER        PRIV_USER       SCHEMA_USER                    LAST_DATE LAST_SEC   FAILURES WHAT
---------- --------------- --------------- ------------------------------ --------- -------- ---------- ----------------------------------------
NLS_ENV
--------------------------------------------------------------------------------------------------------------------------------------------------------------------------------------------------------------------------------------------------------------------------------------------------------------------------------------------------------------------------------------------------------------------------------------------------------------------------------------------------------------------
         3 USER1    USER1    USER1                   12-JUN-14 04:00:00          0 Proc_Cleandata_Close38days( );
NLS_LANGUAGE='ENGLISH' NLS_TERRITORY='CANADA' NLS_CURRENCY='$' NLS_ISO_CURRENCY='CANADA' NLS_NUMERIC_CHARACTERS='.,' NLS_DATE_FORMAT='RR-MM-DD' NLS_DATE_LANGUAGE='ENGLISH' NLS_SORT='BINARY'

Here, everything seems similar but the NLS_ENV has a variation and the main clue I got here is the NLS_DATE_FORMAT that the job contains.

The procedure selects the data to delete with the following query involving date conversion.

SELECT * FROM TABLE1 WHERE COLUMN1 = 4 AND TO_DATE(LASTUPDATETIME, 'YYYY-MM-DD') <=  TO_DATE(SYSDATE-38, 'YYYY-MM-DD') ORDER BY LASTUPDATETIME, REPORTID;

With the default NLS_DATE_FORMAT of the database,

SQL> select TO_DATE(SYSDATE-38, 'YYYY-MM-DD') from dual;
TO_DATE(S
---------
14-MAY-05

With the  NLS_DATE_FORMAT set to 'RR-MM-DD', 
SQL> select TO_DATE(SYSDATE-38, 'YYYY-MM-DD') from dual;
TO_DATE(
--------
14-05-05

This is where the issue lies and this is the reason the database picks up the wrong data to be deleted.
Now how does the NLS_ENV set to a different setting other then the source? We used different character set for source and target for the migration (WE8ISO8859P1 to WE8MSWIN1252) but when exporting and importing we have set the correct character set in the client session. So how does the NLS_ENV differs again?
After coming across the Oracle Support note "The Priority of NLS Parameters Explained (Where To Define NLS Parameters) (Doc ID 241047.1)", it is mentioned as below.
"DBMS_SCHEDULER or DBMS_JOB store the SESSION values of the SUBMITTING session for each job. This is visible in the NLS_ENV column of DBA_SCHEDULER_JOBS or DBA_JOBS"
So the NLS_ENV values are dependent on the session submitting the job. While importing data, the session was set to use NLS_LANG=AMERICAN_AMERICA.WE8MSWIN1252 and hence the default values of the mentioned NLS_LANG were set to the job.

How do we change the NLS_ENV of the job?
Now I have dropped the job and started a new session to set the desired NLS_ENV.

$ export ENGLISH_CANADA.WE8MSWIN1252

Now when login to database and check the NLS parameters, this looked like this.

PARAMETER                                                        VALUE
---------------------------------------------------------------- ----------------------------------------------------------------
NLS_LANGUAGE                                                     ENGLISH
NLS_TERRITORY                                                    CANADA
NLS_CURRENCY                                                     $
NLS_ISO_CURRENCY                                                 CANADA
NLS_DATE_FORMAT                                                  RR-MM-DD
NLS_DATE_LANGUAGE                                                ENGLISH
NLS_CHARACTERSET                                                 WE8MSWIN1252
NLS_SORT                                                         BINARY

Now I have submit the job using the above settings and check the NLS_ENV of the job which looked like below.

JOB LOG_USER        PRIV_USER       SCHEMA_USER                    LAST_DATE LAST_SEC   FAILURES WHAT
---------- --------------- --------------- ------------------------------ --------- -------- ---------- ----------------------------------------
NLS_ENV
--------------------------------------------------------------------------------------------------------------------------------------------------------------------------------------------------------------------------------------------------------------------------------------------------------------------------------------------------------------------------------------------------------------------------------------------------------------------------------------------------------------------
         2 USER1       USER1       USER1                      12-JUN-14 00:00:01          0 Proc_Cleandata_Close38days( );
NLS_LANGUAGE='ENGLISH' NLS_TERRITORY='CANADA' NLS_CURRENCY='$' NLS_ISO_CURRENCY='CANADA' NLS_NUMERIC_CHARACTERS='.,' NLS_DATE_FORMAT='RR-MM-DD' NLS_DATE_LANGUAGE='ENGLISH' NLS_SORT='BINARY'

Now the procedure picks the right data and the issue is resolved.
The blog post is to explain how to set the NLS_ENV and hence the solution is provided as above. 
There is also another solution to this issue.
The select query which picks the data to delete is using date conversion.

So using  
SELECT * FROM TABLE1 WHERE COLUMN1 = 4 AND LASTUPDATETIME <=  SYSDATE-38 ORDER BY LASTUPDATETIME, REPORTID;
instead of
SELECT * FROM TABLE1 WHERE COLUMN1 = 4 AND TO_DATE(LASTUPDATETIME, 'YYYY-MM-DD') <=  TO_DATE(SYSDATE-38, 'YYYY-MM-DD') ORDER BY LASTUPDATETIME, REPORTID;
will resolve the issue as well. This is an application provided query and business will not accept to do the desired change in the query level. :)

Happy Troubleshooting!!

Monday, October 21, 2013

RMAN errors out with ORA-01008: not all variables bound

One of our DB has a problem with RMAN backups with the error as below.

DBGSQL:     TARGET> select count(*) into :dbstate from v$parameter where lower(name) = '_dummy_instance' and upper(value) = 'TRUE'
DBGSQL:        sqlcode = 1008
RMAN-00571: ===========================================================
RMAN-00569: =============== ERROR MESSAGE STACK FOLLOWS ===============
RMAN-00571: ===========================================================
RMAN-00554: initialization of internal recovery manager package failed
RMAN-06003: ORACLE error from target database:
ORA-01008: not all variables bound

This is frustrating when doing any task with RMAN, even you can't log in to RMAN prompt as it says initialization of internal recovery manager package failed. The database version here is 11.2.0.2.0. Oracle support says this is related to bug 9877980 which happens when cursor sharing is set to force or similar.

We have cursor_sharing set to force. So obviously we have hit a bug.
The possible workaround is to just flush the shared pool. Yes, just flush the shared pool.

SQL> alter system flush shared_pool;
System altered.

Now you will be able to connect to the database through RMAN without any issues.

The detailed notes can be obtained from Oracle Support Doc ID 1472116.1.
By the way, the issue is fixed in 11.2.0.3 and above.

Happy troubleshooting...

Wednesday, July 3, 2013

IO ERROR: THE NETWORK ADAPTOR COULD NOT ESTABLISH THE CONNECTION

Today we handed over a newly created database on a newly built server to application team for their testing and operations. We completed all the procedures before handing over the database to the apps team which includes registering of database in the listener. Application team started to log in to the system using SQL Developer to get the following error.


Application team members called us to help them resolve the issue. So at the first glance I couldn't guess anything regarding the issue as it states IO Error. So I took the case and tried to figure out what is wrong with this. 

I tried to ping the server from my system remotely to which it was successful.


Next step is to edit the tnsnames.ora file to include the tns entry for the connection and try tnsping. Now I tried tnsping from my system after editing the tnsnames.ora file but to get an error.


This error says destination host unreachable.
Checking the host server and the listener status.

We just pinged the server and also listener is running fine on the server and also we are able to connect to the database using connect string from the same server as below.


A general search on the Oracle support docs gave the exact problem, cause and the solution.
MOS note id “TNSPING fails with TNS-12543: TNS:destination host unreachable [ID 1556918.1]” suggested the cause as
This might be a network issue with either the underlying transport not being able to contact the host, or a firewall is blocking this client or connection.
Make sure the network is functioning correctly.

So the fix would be to contact the OS/Network admin. Hence I involved the OS admin to fix the networking issue after explaining what’s happening with the issue.

OS team then confirmed that iptables process is running on the server which is a firewall package in Linux. So once after stopping the iptables process, we are now able to connect to the database from remote servers.

The problem is resolved. :-) Happy troubleshooting!!

Thursday, June 20, 2013

RESIZING ONLINE REDOLOG FILES

The following demonstration shows how to resize the online redo log files in an oracle database.
The query below gives the size of all the online redo log files which is 250MB.

SQL> SELECT a.group#, a.member, b.bytes FROM v$logfile a, v$log b WHERE a.group# = b.group#;

    GROUP# MEMBER                                                  BYTES
---------- -------------------------------------------------- ----------
         1 /fs02/oradata/demo/demo_redo1a.log            262144000
         1 /fs03/oradata/demo/demo_redo1b.log            262144000
         1 /fs04/oradata/demo/demo_redo1c.log            262144000
         2 /fs02/oradata/demo/demo_redo2a.log            262144000
         2 /fs03/oradata/demo/demo_redo2b.log            262144000
         2 /fs04/oradata/demo/demo_redo2c.log            262144000
         3 /fs02/oradata/demo/demo_redo3a.log            262144000
         3 /fs03/oradata/demo/demo_redo3b.log            262144000
         3 /fs04/oradata/demo/demo_redo3c.log            262144000

9 rows selected.

Check the status of the log group.

SQL> select group#, status from v$log;

    GROUP# STATUS
---------- ----------------
         1 CURRENT
         2 INACTIVE
         3 INACTIVE

Now force a log switch until the last redo log is marked "CURRENT" by issuing the following command:

SQL> alter system switch logfile;

SQL> alter system switch logfile;

SQL> select group#, status from v$log;

    GROUP# STATUS
---------- ----------------
         1 INACTIVE
         2 INACTIVE
         3 CURRENT


Drop the first logfile group and recreate the same with the desired size, in this case 512MB

SQL> alter database drop logfile group 1;

Database altered.

or

SQL> alter database drop logfile group 1;
ALTER DATABASE DROP LOGFILE GROUP 1
*
ERROR at line 1:
ORA-01624: log 1 needed for crash recovery of instance ORA920 (thread 1)
ORA-00312: online log 1 thread 1: '<file_name>'

Nothing to panic here and this is an easy problem to resolve. Simply perform a checkpoint on the database and try to drop again.

SQL> alter system checkpoint global;

System altered.

SQL> alter database drop logfile group 1;

Database altered.
---------------------------------------------------------------------------------------------------

Re-create the dropped redo log group with different size

alter database add logfile group 1 (
   '/fs02/oradata/demo/demo_redo1a.log', 
   '/fs03/oradata/demo/demo_redo1b.log',
   '/fs04/oradata/demo/demo_redo1c.log') size 500m reuse;

After re-creating the online redo log group, force a log switch. The online redo log group just created should become the "CURRENT" one.

SQL> select group#, status from v$log;

    GROUP# STATUS
---------- ----------------
         1 UNUSED
         2 INACTIVE
         3 CURRENT

SQL> alter system switch logfile;

SQL> select group#, status from v$log;

    GROUP# STATUS
---------- ----------------
         1 CURRENT
         2 INACTIVE
         3 ACTIVE


Do the same for all the logfiles.

alter database add logfile group 2 (
   '/fs02/oradata/demo/demo_redo2a.log', 
   '/fs03/oradata/demo/demo_redo2b.log',
   '/fs04/oradata/demo/demo_redo2c.log') size 500m reuse;


alter database add logfile group 3 (
   '/fs02/oradata/demo/demo_redo3a.log', 
   '/fs03/oradata/demo/demo_redo3b.log',
   '/fs04/oradata/demo/demo_redo3c.log') size 500m reuse;

Now, if you check the sizes of the logfiles you can see the size increased.

SQL> SELECT a.group#, a.member, b.bytes FROM v$logfile a, v$log b WHERE a.group# = b.group#;

    GROUP# MEMBER                                                  BYTES
---------- -------------------------------------------------- ----------
         1 /fs02/oradata/demo/demo_redo1a.log            524288000
         1 /fs03/oradata/demo/demo_redo1b.log            524288000
         1 /fs04/oradata/demo/demo_redo1c.log            524288000
         2 /fs02/oradata/demo/demo_redo2a.log            524288000
         2 /fs03/oradata/demo/demo_redo2b.log            524288000
         2 /fs04/oradata/demo/demo_redo2c.log            524288000
         3 /fs02/oradata/demo/demo_redo3a.log            524288000
         3 /fs03/oradata/demo/demo_redo3b.log            524288000
         3 /fs04/oradata/demo/demo_redo3c.log            524288000


9 rows selected.

Mission accomplished. :-)

Wednesday, January 16, 2013

APPLIED column on v$archived_log when Standby database is setup


We use a simple concept to check for any standby gap or logs apply problems in all the high availability (Dataguard) servers in our environment. Use the below query in a script and make it run from cron periodically so we don’t have to go and check manually all the time.

spool /home/oracle/dba_scripts/logs/standby_db_sync_err.txt

select PRIM-SEC from
(select MAX(SEQUENCE#) PRIM FROM V$ARCHIVED_LOG WHERE DEST_ID=1 AND ARCHIVED='YES'),
(select MAX(SEQUENCE#) SEC FROM V$ARCHIVED_LOG WHERE DEST_ID=2 AND APPLIED='YES');

spool off

Today I received log applied gaps error alert mail stating we have a log applied gap of 24 logs. My script runs every hour and sends the alert mail only when the log applied gap crosses 10 logs since I have delay parameter set in the database.
Note: I used the term “log applied gaps” as I’m meaning that the term is used to differentiate the logs applied on primary with logs applied on standby database.

I first thought that there might be some activity going on in the database and the gap will catch up soon as this happens most of the time, but now the gaps increased to 35, the next hour. So something is wrong , and I should check it.

I used the following query on the standby database which gave the below.

SQL> select sequence#, process, status from v$managed_standby;

 SEQUENCE# PROCESS   STATUS
---------- --------- ------------
         0 ARCH      CONNECTED
         0 ARCH      CONNECTED
         0 ARCH      CONNECTED
         0 ARCH      CONNECTED
         0 ARCH      CONNECTED
     65999 MRP0      WAIT_FOR_LOG
     66007 RFS       IDLE
     66008 RFS       IDLE
     66009 RFS       IDLE

This is obvious, RFS gets the logs as and when generated at primary and MRP waits until the “delay” time reaches before it applies. The gap is not much but only 10 logs. Then I thought why the script gives wrong information?
I ran the script manually to check and still receive the same alert mail of log applied gap 35. So I ran the query separately in primary database to check/troubleshoot what is going on. I got the below response from the primary database.

SQL> select MAX(SEQUENCE#) PRIM FROM V$ARCHIVED_LOG WHERE DEST_ID=1 AND ARCHIVED='YES';

      PRIM
----------
     66010

SQL> select MAX(SEQUENCE#) SEC FROM V$ARCHIVED_LOG WHERE DEST_ID=2 AND APPLIED='YES';

       SEC
----------
     65975

Ok, I just wait for some time and check the same again but to see the same result. (Many a times, in standby environment I get the results delayed. J )

Now, it’s time to dig Oracle support documents to find what is really going on. I thought it might be some sort of bug as I haven’t faced such an issue before. As my prediction it turns to be a bug.
The MOS article “APPLIED - Column not updated if Heartbeat-ARCH hangs [ID 1369630.1]” states the issue we are dealing with is due to the bug “Bug 6113783 - Arch processes can hang indefinitely on network [ID 6113783.8]”.

The bug is fixed in 11.2.0.1 base release and I’m currently running my database in 10.2.0.4.
There are 2 options provided.
  1. Upgrade DB to 11.2.0.1 or higher
  2. Use the work around of killing the hung ARCH process in the primary database.


Option 2 looked feasible at this time as upgrading of the DB requires a lot of approvals, application compatibility, etc., etc.,.

So how to find the hung ARCH process?

MOS says Look for Messages like
"ARCn: Becoming the heartbeat ARCH"
in the ALERT.LOG of the Primary Database to determine the current Heartbeat ARCn-Process.

So I searched my alert log file to find the below.

Fri Aug 17 05:04:08 2012
ARC2: Becoming the heartbeat ARCH
ARC3 started with pid=103, OS id=28106
Fri Aug 17 05:04:08 2012

Check for the OS process id for ARC2
[oracle@slv00112 bdump]$ ps -ef|grep ora_arc
oracle   32224     1  0  2012 ?        02:43:53 ora_arc0_edisipd
oracle   32226     1  0  2012 ?        02:21:49 ora_arc1_edisipd
oracle   32232     1  0  2012 ?        02:41:07 ora_arc2_edisipd
oracle   32234     1  0  2012 ?        02:26:41 ora_arc3_edisipd
oracle   23429 16642  0 04:51 pts/1    00:00:00 grep ora_arc

Kill the Hung ARCH process

[oracle@slv00112 bdump]$ kill -9 32232

Now check the alert log file again to find the below.

ARCH: Detected ARCH process failure
ARCH: STARTING ARCH PROCESSES
ARC2: Archival started
ARCH: STARTING ARCH PROCESSES COMPLETE
ARC2 started with pid=67, OS id=23425
ARC2: Becoming the heartbeat ARCH
Wed Jan 16 04:53:47 2013

Ok, now the new process has been generated. Hence check with the primary database whether the APPLIED column is updated.

SQL> select MAX(SEQUENCE#) SEC FROM V$ARCHIVED_LOG WHERE DEST_ID=2 AND APPLIED='YES';

       SEC
----------
     66003

Now it has been updated successfully. J

Monday, October 8, 2012

REDUCE TOP WAIT EVENTS – AN ATTEMPT


This article is prepared to show how I take steps to reduce the top wait events in a busy system running in my environment. As always your comments and suggestions are welcome so that you and I can learn oracle and benefited mutually.

For basic tuning steps and some threshold values please refer to the links below.


These links above give you the basics of performance tuning. Mind this is very old approach and many things have changed from this approach. But when speaking about threshold metrics, you can use those individual queries to check the performance metrics.  

For eg.

select 100*(1 - (v3.value / (v1.value + v2.value))) "Cache Hit Ratio [%]"
from v$sysstat v1, v$sysstat v2, v$sysstat v3
where
v1.name = 'db block gets' and
v2.name = 'consistent gets' and
v3.name = 'physical reads';

The above query is used to calculate the buffer cache hit ratio and typically it should be very high (more than 90%)

Ok, coming to the point where I fine tuned the application is as below.

Scenario: This is an application where batch jobs of huge amount of data (millions of rows) are deleted and updated/inserted on a daily basis. Application team reported that the application is responding very slowly than before as their delete job runs 4~5 folds slower.
While generating the AWR report at the specified time (the time the delete/insert batch job runs), we can find the below report portion.

I have got the instance efficiency percentages as below


You can see from the above that the buffer hit percentage is nearly 100% and comparatively library hit and soft parse % are good as well. We can tune the machine to increase the soft parse % here by making either the SGA to a bigger value or by making use of bind variables (This is an application where many queries are using bind variables and still the value is low, reason being cursor_sharing is set to EXACT which will not take sql statements which use bind variables as used statement and takes every statement as new statement).

While generating the AWR report at the specified time (the time the delete/insert batch job runs), we can find the below report portion.


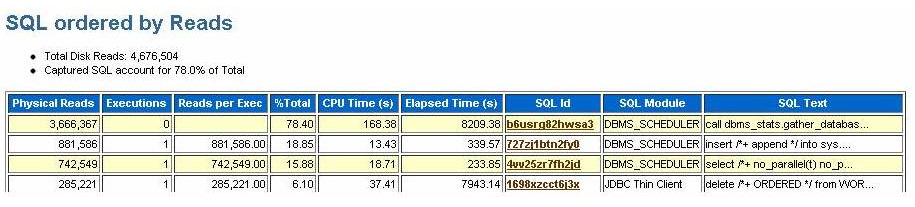
The Top 5 timed event resulted as above which shows that the reads are taking time in the system. Hence check with the SQL ordered by Reads as below.


Looking at the statistics from the AWR report, the following query is consuming more reads.

  1. call dbms_stats.gather_database_stats_job_proc ( )        
  2. insert /*+ append */ into sys.ora_temp_1_ds_28645 select /*+ no_parallel(t) no_parallel_index(t) dbms_stats cursor_sharing_exact use_weak_name_resl dynamic_sampling(0) no_monitoring */"OBJECT_ID", "ARCHIVE_DATE", "WF_ID", "REC_TIME", rowid SYS_DS_ALIAS_0 from "EDIAPP"."CORRELATION_SET" sample ( .3482546807) t

Looking at the statistics above, it is clear that most of the reads are consumed by statistics gatherer run by scheduler jobs which is scheduled to run automatically in oracle 10g using DBMS_STATS.
The task is scheduled in WEEKNIGHT_WINDOW of the DBA_SCHEDULER_WINDOWS which starts daily at 10 00 pm EST.

So in order to reduce this waits on db file sequential read, its better we disable this scheduled job as we have statistics gathering run explicitly.

Also init parameter db_file_multiblock_read_count is currently set to 32. Oracle recommends not setting this value manually and letting oracle choose the optimal value. So we can make this alteration as a step to improve the performance.

The other wait events log file sync and log file parallel write are related to each other. By decreasing the log file sync wait even, we can reduce log file parallel write wait event.
From dataguard perspective (as we have dataguard set up for this environment),
For Data Guard with synchronous (SYNC) transport and commit WAIT defaults, log file parallel write also includes the time for the network write and the RFS/redo write to the standby redo logs. This makes us clear that an improved network can improve the waits encountered.

Steps to improve the performance by eliminating the above wait events is as follows.

  • Tune LGWR to get good throughput to disk . eg: Do not put redo logs on RAID 5. à This is checked by Unix admin and made clear files are not in RAID 5  
  • If there are lots of short duration transactions see if it is possible to BATCH transactions together so there are fewer distinct COMMIT operations. Each commit has to have it confirmed that the relevant REDO is on disk. Although commits can be "piggybacked" by Oracle reducing the overall number of commits by batching transactions can have a very beneficial effect. à Apps team should take this into account for improving performance and hence advised them the same.
  • See if any of the processing can use the COMMIT NOWAIT option (be sure to understand the semantics of this before using it). à This is not recommended though
  • See if any activity can safely be done with NOLOGGING / UNRECOVERABLE options. à Compromises high availability and hence is not recommended as we have standby setup
  • Check to see if redologs are large enough. Enlarge the redologs so the logs switch between 15 to 20 minutes. à Current redo log size is 500 mb. We can increase this to 1gb so the log switch takes increased time.

Action plan would be as follows.

  1. Disable scheduled jobs to collect statistics
  2. Change db_file_multiblock_read_count value
  3. Increase redo logs to 1gb
  4. Reduce log buffers from the current size
The above example may provide a good feed to your white paper as this is the live tuning that has been recommended to application team and this works well after reducing log buffers size. This resulted in decreased log file sync.
The statistics were gathered for the database and indexes (for the tables that were affected by the batch job) were rebuilt and the performance is monitored again. This shows a very good increase in performance by reduction of sequential read and scattered read. Application team is satisfied with the performance which is the primary goal.

Thank you!! J Happy tuning!! JJ

Tuesday, August 7, 2012

A simple RMAN crosscheck mess up!!


Today I was attempting to rebuild a standby database as we had done some mess up with the production by placing some of the tables in "nologging" mode and relocating few datafiles due to file system space issues. It is easy to recover the standby by replacing the files from the primary and using the standby_management=manual mode to relocate the files in the standby as well. But the problem is we don't know where we started and where the situation is... Primary database is running fine after the maintenance but we lack the high availability as the standby is a day back. Hence I have decided to rebuild the standby which will take not more than 2~3 hours with a valid backup. Remember this is a database of version 10.2.0.4.0 running on Linux EL5.

Steps that has been done.

1. Backup taken from source database (Primary)
2. Backup pieces were moved to target server and the some of the backup pieces on the primary server is deleted as thinking as this DB is a 11g DB where we have feature of source database is not required to create clone. Then after realising the DB as 10g, again replaced the backups on the server.
3. Control file backup is taken for standby and transfered to the target server.

Now the actual story starts.

On target server.

RMAN> run
{
configure channel device type disk parallel 8;
duplicate target database for standby nofilenamecheck dorecover;
}
2> 3>
RMAN-00571: ===========================================================
RMAN-00569: =============== ERROR MESSAGE STACK FOLLOWS ===============
RMAN-00571: ===========================================================
RMAN-00558: error encountered while parsing input commands
RMAN-01009: syntax error: found "parallel": expecting one of: "clear, connect, debug, format, kbytes, maxopenfiles, maxpiecesize, parms, readrate, rate, send, to, trace"
RMAN-01007: at line 3 column 36 file: standard input

RMAN>
Starting Duplicate Db at 06-AUG-12
using target database control file instead of recovery catalog
allocated channel: ORA_AUX_DISK_1
channel ORA_AUX_DISK_1: sid=541 devtype=DISK
allocated channel: ORA_AUX_DISK_2
channel ORA_AUX_DISK_2: sid=540 devtype=DISK
allocated channel: ORA_AUX_DISK_3
channel ORA_AUX_DISK_3: sid=539 devtype=DISK
allocated channel: ORA_AUX_DISK_4
channel ORA_AUX_DISK_4: sid=538 devtype=DISK
allocated channel: ORA_AUX_DISK_5
channel ORA_AUX_DISK_5: sid=537 devtype=DISK

contents of Memory Script:
{
   set until scn  5170555877;
   restore clone standby controlfile;
   sql clone 'alter database mount standby database';
}
executing Memory Script
..
..
..
executing command: SET NEWNAME

executing command: SET NEWNAME

executing command: SET NEWNAME

Starting restore at 06-AUG-12
allocated channel: ORA_AUX_DISK_1
channel ORA_AUX_DISK_1: sid=537 devtype=DISK
allocated channel: ORA_AUX_DISK_2
channel ORA_AUX_DISK_2: sid=538 devtype=DISK
allocated channel: ORA_AUX_DISK_3
channel ORA_AUX_DISK_3: sid=539 devtype=DISK
allocated channel: ORA_AUX_DISK_4
channel ORA_AUX_DISK_4: sid=540 devtype=DISK
allocated channel: ORA_AUX_DISK_5
channel ORA_AUX_DISK_5: sid=541 devtype=DISK

creating datafile fno=2 name=/fs05/oradata/edisipd/edisipd_UNDOTBS_01.dbf
creating datafile fno=5 name=/fs05/oradata/edisipd/edisipd_UNDOTBS_02.dbf
creating datafile fno=8 name=/fs02/oradata/edisipd/edisipd_EDIAPP_DATA_03.dbf
creating datafile fno=15 name=/fs02/oradata/edisipd/edisipd_EDIAPP_DATA_10.dbf
creating datafile fno=17 name=/fs02/oradata/edisipd/edisipd_EDIAPP_DATA_12.dbf
creating datafile fno=18 name=/fs02/oradata/edisipd/edisipd_EDIAPP_DATA_13.dbf
creating datafile fno=19 name=/fs02/oradata/edisipd/edisipd_EDIAPP_DATA_14.dbf
creating datafile fno=23 name=/fs02/oradata/edisipd/edisipd_EDIAPP_DATA_18.dbf
..
..
..
using channel ORA_AUX_DISK_2
using channel ORA_AUX_DISK_3
using channel ORA_AUX_DISK_4
using channel ORA_AUX_DISK_5

starting media recovery

archive log thread 1 sequence 48527 is already on disk as file /fs01/oradata/edisipd/archive/edisipd_/1_724685163_48527.arc
Oracle Error:
ORA-01547: warning: RECOVER succeeded but OPEN RESETLOGS would get error below
ORA-01194: file 1 needs more recovery to be consistent
ORA-01110: data file 1: '/fs02/oradata/edisipd/edisipd_SYSTEM_01.dbf'

RMAN-00571: ===========================================================
RMAN-00569: =============== ERROR MESSAGE STACK FOLLOWS ===============
RMAN-00571: ===========================================================
RMAN-03002: failure of Duplicate Db command at 08/07/2012 02:49:36
RMAN-03015: error occurred in stored script Memory Script
RMAN-06053: unable to perform media recovery because of missing log
RMAN-06025: no backup of log thread 1 seq 48412 lowscn 5159567844 found to restore
RMAN-06025: no backup of log thread 1 seq 48411 lowscn 5159485436 found to restore
RMAN-06025: no backup of log thread 1 seq 48410 lowscn 5159410674 found to restore
RMAN-06025: no backup of log thread 1 seq 48409 lowscn 5159350092 found to restore
RMAN-06025: no backup of log thread 1 seq 48408 lowscn 5159263205 found to restore

Check the part where it states "creating datafile fno=......
This is the first time I come across this statement in recovery (standby/clone) of a database. I'm not sure why it is creating file rather recovering it from the backup. I waited for sometime so that the recover completes.
Recover completes with error stating missing logs. Ok, this is expected as I don’t have some of the logs in the standby site.

Now, I started the recovery to see where the MRP stuck does, I mean which log MRP is looking for.

SQL> archive log list
Database log mode              Archive Mode
Automatic archival             Enabled
Archive destination            /fs01/oradata/edisipd/archive/edisipd_
Oldest online log sequence     48550
Next log sequence to archive   0
Current log sequence           48552
SQL> select process, sequence#, status from v$managed_Standby;

PROCESS    SEQUENCE# STATUS
--------- ---------- ------------
ARCH               0 CONNECTED
RFS                0 IDLE
RFS                0 IDLE
RFS                0 IDLE
MRP0               3 WAIT_FOR_GAP

9 rows selected.

This is to my shock!! MRP is waiting for sequence number 3. Man! This is a full backup you are recovering and why in the name of God, MRP looks for sequence# 3? I have to go years back for the log sequence# 3 :-)

I thought for a second and reran the create controlfile statement on the primary database to make sure I have the correct controlfile, transferred it to standby site and started recovery after mounting the database.

SQL> recover standby database;
ORA-00279: change 310139 generated at 07/18/2010 13:52:22 needed for thread 1
ORA-00289: suggestion :
/fs01/oradata/edisipd/archive/edisipd_/1_724685163_3.arc
ORA-00280: change 310139 for thread 1 is in sequence #3


Specify log: {<RET>=suggested | filename | AUTO | CANCEL}
auto
ORA-00308: cannot open archived log
'/fs01/oradata/edisipd/archive/edisipd_/1_724685163_3.arc'
ORA-27037: unable to obtain file status
Linux-x86_64 Error: 2: No such file or directory
Additional information: 3

This again is looking for sequence# 3. So something is not right. But what is not right?
Then I checked manually myself with the backup pieces on both the servers, whether both the servers have equal number of files and their sizes. They are perfect.
Now I logged into primary database RMAN to see how many pieces have been produced while taking backup. 14 pieces have been produced and I have 14 pieces on the physical file system. So still I couldn't find what is wrong.

Now, once again I counted the number of pieces produced and got this..

RMAN> list backup tag ‘FORSTANDBY’;
..
..
..
  57      Full 5163187056 06-AUG-12 /fs04/oradata/edisipd/edisipd_EDIAPP_INDEX_12.dbf
  69      Full 5163187056 06-AUG-12 /fs05/oradata/edisipd/edisipd_EDIAPP_INDEX_24.dbf
  77      Full 5163187056 06-AUG-12 /fs06/oradata/edisipd/edisipd_EDIADT_DATA_02.dbf

BS Key  Type LV Size       Device Type Elapsed Time Completion Time
------- ---- -- ---------- ----------- ------------ ---------------
31223   Full    3.16G      DISK        00:28:35     06-AUG-12
        BP Key: 31464   Status: EXPIRED  Compressed: YES  Tag: FORSTANDBY
        Piece Name: /backups/stbkp/ForStandby_sknhuobu_1_1
  List of Datafiles in backup set 31223
  File LV Type Ckp SCN    Ckp Time  Name
  ---- -- ---- ---------- --------- ----
  23      Full 5163317451 06-AUG-12 /fs02/oradata/edisipd/edisipd_EDIAPP_DATA_18.dbf
  25      Full 5163317451 06-AUG-12 /fs02/oradata/edisipd/edisipd_EDIAPP_DATA_20.dbf
  54      Full 5163317451 06-AUG-12 /fs04/oradata/edisipd/edisipd_EDIAPP_INDEX_09.dbf
  64      Full 5163317451 06-AUG-12 /fs05/oradata/edisipd/edisipd_EDIAPP_INDEX_19.dbf

BS Key  Type LV Size       Device Type Elapsed Time Completion Time
------- ---- -- ---------- ----------- ------------ ---------------
31224   Full    4.03G      DISK        00:45:33     06-AUG-12
        BP Key: 31465   Status: EXPIRED  Compressed: YES  Tag: FORSTANDBY
        Piece Name: /backups/stbkp/ForStandby_sinhunrb_1_1
  List of Datafiles in backup set 31224
  File LV Type Ckp SCN    Ckp Time  Name
  ---- -- ---- ---------- --------- ----
..
..
..

Some of the backup pieces were in EXPIRED status. I now remember my colleague called me today morning to inform that she moved some of the backup pieces to other file system and issued the "crosscheck backup" RMAN command when the files where deleted from primary server after transfer to standby site. After this the backup pieces were restored to the file system so the files were not cataloged to the control file.


The reason why “create datafile” is issued by RMAN is now clear. Controlfile has the details about the datafiles but the backup pieces were missing to restore/recover. Hence it creates the datafiles on the given name and it should start recover from the beginning and hence looking for sequence# 3. My confusion is now at a halt. J

Now I crosschecked the pieces once again using RMAN crosscheck command so that these pieces were cataloged to the control file. Then I started the cloning for standby which ran perfect as expected.
For the detailed steps on creating a standby database using RMAN please check the below link.

Thank you!!