Showing posts with label Performance. Show all posts

Monday, October 8, 2012

REDUCE TOP WAIT EVENTS – AN ATTEMPT


This article is prepared to show how I take steps to reduce the top wait events in a busy system running in my environment. As always your comments and suggestions are welcome so that you and I can learn oracle and benefited mutually.

For basic tuning steps and some threshold values please refer to the links below.


These links above give you the basics of performance tuning. Mind this is very old approach and many things have changed from this approach. But when speaking about threshold metrics, you can use those individual queries to check the performance metrics.  

For eg.

select 100*(1 - (v3.value / (v1.value + v2.value))) "Cache Hit Ratio [%]"
from v$sysstat v1, v$sysstat v2, v$sysstat v3
where
v1.name = 'db block gets' and
v2.name = 'consistent gets' and
v3.name = 'physical reads';

The above query is used to calculate the buffer cache hit ratio and typically it should be very high (more than 90%)

Ok, coming to the point where I fine tuned the application is as below.

Scenario: This is an application where batch jobs of huge amount of data (millions of rows) are deleted and updated/inserted on a daily basis. Application team reported that the application is responding very slowly than before as their delete job runs 4~5 folds slower.
While generating the AWR report at the specified time (the time the delete/insert batch job runs), we can find the below report portion.

I have got the instance efficiency percentages as below


You can see from the above that the buffer hit percentage is nearly 100% and comparatively library hit and soft parse % are good as well. We can tune the machine to increase the soft parse % here by making either the SGA to a bigger value or by making use of bind variables (This is an application where many queries are using bind variables and still the value is low, reason being cursor_sharing is set to EXACT which will not take sql statements which use bind variables as used statement and takes every statement as new statement).

While generating the AWR report at the specified time (the time the delete/insert batch job runs), we can find the below report portion.


The Top 5 timed event resulted as above which shows that the reads are taking time in the system. Hence check with the SQL ordered by Reads as below.
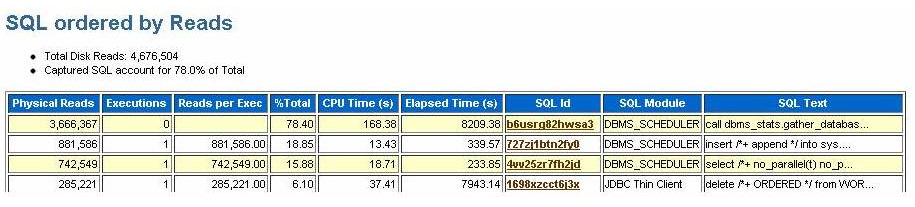


Looking at the statistics from the AWR report, the following query is consuming more reads.

  1. call dbms_stats.gather_database_stats_job_proc ( )        
  2. insert /*+ append */ into sys.ora_temp_1_ds_28645 select /*+ no_parallel(t) no_parallel_index(t) dbms_stats cursor_sharing_exact use_weak_name_resl dynamic_sampling(0) no_monitoring */"OBJECT_ID", "ARCHIVE_DATE", "WF_ID", "REC_TIME", rowid SYS_DS_ALIAS_0 from "EDIAPP"."CORRELATION_SET" sample ( .3482546807) t

Looking at the statistics above, it is clear that most of the reads are consumed by statistics gatherer run by scheduler jobs which is scheduled to run automatically in oracle 10g using DBMS_STATS.
The task is scheduled in WEEKNIGHT_WINDOW of the DBA_SCHEDULER_WINDOWS which starts daily at 10 00 pm EST.

So in order to reduce this waits on db file sequential read, its better we disable this scheduled job as we have statistics gathering run explicitly.

Also init parameter db_file_multiblock_read_count is currently set to 32. Oracle recommends not setting this value manually and letting oracle choose the optimal value. So we can make this alteration as a step to improve the performance.

The other wait events log file sync and log file parallel write are related to each other. By decreasing the log file sync wait even, we can reduce log file parallel write wait event.
From dataguard perspective (as we have dataguard set up for this environment),
For Data Guard with synchronous (SYNC) transport and commit WAIT defaults, log file parallel write also includes the time for the network write and the RFS/redo write to the standby redo logs. This makes us clear that an improved network can improve the waits encountered.

Steps to improve the performance by eliminating the above wait events is as follows.

  • Tune LGWR to get good throughput to disk . eg: Do not put redo logs on RAID 5. à This is checked by Unix admin and made clear files are not in RAID 5  
  • If there are lots of short duration transactions see if it is possible to BATCH transactions together so there are fewer distinct COMMIT operations. Each commit has to have it confirmed that the relevant REDO is on disk. Although commits can be "piggybacked" by Oracle reducing the overall number of commits by batching transactions can have a very beneficial effect. à Apps team should take this into account for improving performance and hence advised them the same.
  • See if any of the processing can use the COMMIT NOWAIT option (be sure to understand the semantics of this before using it). à This is not recommended though
  • See if any activity can safely be done with NOLOGGING / UNRECOVERABLE options. à Compromises high availability and hence is not recommended as we have standby setup
  • Check to see if redologs are large enough. Enlarge the redologs so the logs switch between 15 to 20 minutes. à Current redo log size is 500 mb. We can increase this to 1gb so the log switch takes increased time.

Action plan would be as follows.

  1. Disable scheduled jobs to collect statistics
  2. Change db_file_multiblock_read_count value
  3. Increase redo logs to 1gb
  4. Reduce log buffers from the current size
The above example may provide a good feed to your white paper as this is the live tuning that has been recommended to application team and this works well after reducing log buffers size. This resulted in decreased log file sync.
The statistics were gathered for the database and indexes (for the tables that were affected by the batch job) were rebuilt and the performance is monitored again. This shows a very good increase in performance by reduction of sequential read and scattered read. Application team is satisfied with the performance which is the primary goal.

Thank you!! J Happy tuning!! JJ

Sunday, May 20, 2012

Datapump - some tips


Data Pump is a utility for unloading/loading data and metadata into a set of operating system files called a dump file set. The dump file set can be imported only by the Data Pump Import utility. The dump file set can be imported on the same system or it can be moved to another system and loaded there.
In this post, let us see some tips and tricks that can done with Datapump. 

Tip #1 : Using PARALLEL parameter
PARALLEL parameter is used to improve the speed of the export. But this will be more effective when you split the dumpfiles with DUMPFILE parameter across the filesystem.
Create 2 or 3 directories in different filesystems and use the commands effectively.

expdp / dumpfile=dir1:test_1.dmp, dir1:test_2.dmp, dir2:test_3.dmp, dir3:test_4.dmp logfile=dir1:test.log full=y parallel=4
where dir1, dir2 and dir3 are directory names created in the database.

Tip #2 : Using FILESIZE parameter
FILESIZE parameter is used to limit the dumpfile size. For eg., if you want to limit your dumpfiles to 5gb, you can issue command as below

expdp / directory=dir1 dumpfile=test1.dmp,test2.dmp,test3.dmp logfile=test.log filesize=5120m
or 
expdp / directory=dir1 dumpfile=test_%U.dmp logfile=test.log filesize=5120m full=y
where %U will assign numbers automatically from 1 to 99. 

Note: If you use %U, dumpfile number 100 can't be created and export fails with "dumpfile exhausted" error.

Update (23 July 2013): If you want to create more than 99 files, you can use this work around. 
expdp / directory=dir1 dumpfile=test_%U.dmp dumpfile=test_1%U.dmp logfile=test.log filesize=5120m full=y

This will create files in a round robin method like below.
test_01.dmp
test_101.dmp
test_02.dmp
test_102.dmp

Tip #3 : Usage of VERSION parameter
VERSION parameter is used while taking export if you want to create a dumpfile which should be imported into a DB which is lower than the source DB. 
For eg., if your source DB is 11g and target DB is 10g, you can't use the dumpfile taken from 11g expdp utility to import into 10g DB. 
This throws the below error.
ORA-39142: incompatible version number 3.1 in dump file "/u02/dpump/test.dmp"
To overcome this we can use the VERSION parameter.
VERSION={COMPATIBLE | LATEST | version_string}
Eg.: expdp / directory=dir1 dumpfile=test_1.dmp logfile=test.log VERSION=10.2.0

Tip #4 : PARALLEL with single DUMPFILE
When you use PARALLEL parameter and use only one dumpfile to unload datas from the DB, you may get the below error.
expdp / directory=dir1 dumpfile=test_1.dmp logfile=test.log parallel=4
ORA-39095: Dump file space has been exhausted: Unable to allocate 8192 bytes 
Job "USER"."TABLE_UNLOAD" stopped due to fatal error at 00:37:29
Now a simple work around is to remove the PARALLEL parameter or add dumpfiles. This will over come the error.

expdp / directory=dir1 dumpfile=test_1.dmp logfile=test.log 
or
expdp / directory=dir1 dumpfile=test_1.dmp,test_2.dmp,test_3.dmp, test_4.dmp logfile=test.log parallel=4
or
expdp / directory=dir1 dumpfile=test_%U.dmp logfile=test.log parallel=4

Tip #5 : Drop dba_datapump_job rows
Sometimes before the export completes or when the export encounters a resumable wait or you would have stopped the export job in between. Now you start the DataPump job that stopped. Then the dump file has been removed from the directory location. You are not able to attach to the job. 
You will get an error like this.

ORA-39000: bad dump file specification
ORA-31640: unable to open dump file "/oracle/product/10.2.0/db_2/rdbms/log/test.dmp" for read
ORA-27037: unable to obtain file status
Linux Error: 2: No such file or directory

But you will see the row updated in view dba_datapump_jobs

SQL> select * from dba_datapump_jobs;
OWNER JOB_NAME                       OPERATI JOB_M STATE                              DEGREE ATTACHED_SESSIONS DATAPUMP_SESSIONS
----- ------------------------------ ------- ----- ------------------------------ ---------- ----------------- -----------------
SYS   SYS_EXPORT_FULL_01             EXPORT  FULL  NOT RUNNING                             0        ##########                 0
You are not able to remove the row from dba_datapump_jobs as you are not able to attach to the export job with expdp client to kill the job.
In this case you can remove the row by dropping the master table created by the datapump export.

SQL> drop table SYS_EXPORT_FULL_01 purge;
Table dropped.
SQL> select * from dba_datapump_jobs;
no rows selected

Now you can see the row is deleted from the dba_datapump_jobs view.

Tip #6 : FLASHBACK_SCN and FLASHBACK_TIME 
Do not use FLASHBACK_SCN and FLASHBACK_TIME as these parameters slow down the performace of export.

Tip #7 : Effective EXCLUDE
Import of full database should be split as tables first and indexes next. Use the parameter exclude effectively to improve the speed of import.
EXCLUDE = INDEX,STATISTICS 
This will not import the indexes and statistics which in turn only import the tables, hence improving the performance.

Tip #8 : INDEXFILE=<filename> usage
After the import of tables has been completed, you can create the indexes and collect statistics of the tables. To get the indexes creation ddl, you can use the INDEXFILE = <filename> parameter to get all the indexes creation statements which were involved in the import operation.

Example of effective import 
impdp / directory=dir1,dir2,dir3 dumpfile=test_%U.dmp logfile=test.log EXCLUDE=STATISTICS Full=Y INDEXFILE=index_ddl.sql

The above will turn on the legacy mode import of datapump as the  parameter indexfile is present instead of SQLFILE parameter. 
Indexfile parameter is available in imp and sqlfile parameter with impdp. However you can use indexfile parameter in impdp which will turn on legacy mode import which is as below. 
;;; Legacy Mode Active due to the following parameters:
;;; Legacy Mode Parameter: "indexfile=testindex.sql" Location: Command Line, Replaced with: "sqlfile=index_ddl.sql include=index"

Hence to extract only the indexes the statement should be as below.
impdp / directory=dir1,dir2,dir3 dumpfile=test_%U.dmp logfile=test.log EXCLUDE=STATISTICS Full=Y SQLFILE=index_ddl.sql INCLUDE=INDEX

Note: Tip #8 edited as per comment from Eric below.

Tip #9 : Contents of Dump file
If you are not sure about the schemas that were present in the dumpfile or tablespaces present inside the dumpfile, etc., you can easily check the dumpfile for those information using the below command

grep -a "CREATE USER" test_1.dmp
grep -a "CREATE TABLESPACE" test_1.dmp
-a is not a recognised flag in some OS and hence command works without the flag. Mind, the dumpfile created is a binary file.

The above command gives all the CREATE USER statements and CREATE TABLESPACE statements which will be useful in many cases. You can also get the INDEXES and TABLES creation ddl from the dumpfile as well.

Tip #10 : init.ora parameter cursor_sharing
Always set init.ora parameter cursor_sharing to exact which has a good effect on import's performance.

Tip #11 : STATUS parameter usage
You can check the on going datapump export/import operation with the use of STATUS parameter and track the progress by yourself. You can attach to a export/import session and check the status. 

For example:
[oracle@ini8115l3aa2ba-136018207027 ~]$ expdp attach=SYS_EXPORT_FULL_01
Export: Release 11.2.0.1.0 - Production on Mon May 21 10:56:28 2012
Copyright (c) 1982, 2009, Oracle and/or its affiliates.  All rights reserved.
Username: sys as sysdba
Password:
Connected to: Oracle Database 11g Enterprise Edition Release 11.2.0.1.0 - Production
With the Partitioning, OLAP, Data Mining and Real Application Testing options
Job: SYS_EXPORT_FULL_01
  Owner: SYS
  Operation: EXPORT
  Creator Privs: TRUE
  GUID: C08622D4FB5571E4E04012881BCF4C92
  Start Time: Monday, 21 May, 2012 10:55:55
  Mode: FULL
  Instance: newdb
  Max Parallelism: 1
  EXPORT Job Parameters:
  Parameter Name      Parameter Value:
     CLIENT_COMMAND        sys/******** AS SYSDBA directory=dmpdir full=y
  State: EXECUTING
  Bytes Processed: 0
  Current Parallelism: 1
  Job Error Count: 0
  Dump File: /u02/dpump/expdat.dmp
    bytes written: 4,096
Worker 1 Status:
  Process Name: DW00
  State: EXECUTING
  Object Type: DATABASE_EXPORT/SCHEMA/TABLE/COMMENT
  Completed Objects: 400
  Worker Parallelism: 1
Export> status
Job: SYS_EXPORT_FULL_01
  Operation: EXPORT
  Mode: FULL
  State: COMPLETING
  Bytes Processed: 37,121
  Percent Done: 100
  Current Parallelism: 1
  Job Error Count: 0
  Dump File: /u02/dpump/expdat.dmp
    bytes written: 561,152
Worker 1 Status:
  Process Name: DW00
  State: WORK WAITING

Here you can see the bytes written which will be progressing and you can track the export/import job easily.
Note: The parameter ATTACH when used, it cannot be combined with any other parameter other than the USERID parameter.

$ expdp ATTACH= JOB_NAME

I’ll be updating the post whenever I come across things that can help improving the performance of datapump. J

Thursday, March 31, 2011

Performance Tuning - Part 2

7. Identifying missing indexes

To find the top SQL statements that have caused most block buffer reads:

Select buffer_gets, sql_text
from v$sqlarea
where buffer_gets > 15000
order by buffer_gets desc;

 If this returns a large number of rows then increase the number of ‘buffer_gets’ required, if it returns no rows then decrease this threshold.
Typically, most of these will be select statements of some sort. Considering each in turn, identify what indexes would help with the query and then check that those indexes exist. Create them if necessary.

To find the most frequently executed SQL:

Select executions, buffer_gets, sql_text from v$sqlarea where executions > 10000 order by executions desc;
If this returns a large number of rows then increase the number of ‘executions’ required. If it returns no rows then decrease the number of executions required.

8. Identify index fragmentation

analyze index <index_name> validate structure;
This populates the table ‘index_stats’. It should be noted that this table contains only one row and therefore only one index can be analysed at a time.
An index should be considered for rebuilding under any of the following conditions:
  • The percentage of deleted rows exceeds 30% of the total, i.e. if
    del_lf_rows / lf_rows > 0.3.
  • If the ‘HEIGHT’ is greater than 4.
select HEIGHT, decode (LF_ROWS,0,1,LF_ROWS), DEL_LF_ROWS from sys.index_stats;
  • If the number of rows in the index (‘LF_ROWS’) is significantly smaller than ‘LF_BLKS’ this can indicate a large number of deletes, indicating that the index should be rebuilt.
9. Identifying free list contention

To identify the percentage of requests that resulted in a wait for a free block run the following query:

select round( (sum(decode(w.class,'free list',count,0))/ (sum(decode(name,'db block gets', value, 0))
+ sum(decode(name,'consistent gets', value, 0)))) * 100,2)
from v$waitstat w, v$sysstat;

This should be less than 1%. To reduce contention for a table’s free list the table must be recreated with a larger value in the FREELISTS storage parameter

10.  Identify significant reparsing of SQL

The shared-pool contains (amongst other things) previously parsed SQL, and this allows Oracle to avoid re-parsing SQL unnecessarily.
The following SQL identifies those SQL statements that have needed to be re-parsed numerous times:

select executions, t.sql_text
from v$sqlarea a, v$sqltext t
where parse_calls >1 and parse_calls = executions and a.address=t.address and executions > 10000
order by executions desc;

If this returns a large number of rows then increase the number of ‘executions’ required. If it returns no rows then perhaps decrease the number of executions required.
If there is SQL that is being repeatedly reparsed then consider increasing the value of SHARED_POOL_SIZE.

11.  Reducing database fragmentation

Excessively fragmented tables or indexes can adversely affect performance. Use the following SQL to identify those database objects that have over 10 extents allocated:

select * from dba_segments where extents > 10;
In general, if a table or index has more than 10 extents then rebuild it to fit into one extent.
A table can only be rebuilt by exporting and then importing it. The database will be unavailable for use by applications during this time. The steps to accomplish this are:
  1. Export the table with COMPRESS=Y
  2. Drop the table
  3. Import the table.
An index can be rebuilt without preventing others from still using it. Firstly change the storage parameters to make the ‘next’ storage parameter larger (perhaps double it). The initial storage value cannot be changed. Then rebuild the index. Refer http://oraclemamukutti.blogspot.com/2011/03/rebuild-index.html

I hope this might be an useful document for a beginner Oracle Database Performance Tuning Admin...

Performance Tuning - Part 1

Performance Tuning is a vast area in Oracle Database Administration. Tuning is divided into 3 parts as Oracle database is considered. 1. Performance Planning 2. Instance Tuning 3. SQL Tuning

In this post let's see about some Instance tuning basics which might help many DBAs who are new to performance tuning tasks.

1. Tuning the cache hit ratio

Select sum(getmisses) / sum(gets) "Miss ratio"
From v$rowcache;

If ratio < 15% --> DB fine
If ratio > 15% --> increase shared_pool_size

2. Tuning the library cache

Select sum(pinhits) / sum(pins) "Hit Ratio",
sum(reloads) / sum(pins) "Reload percent"
From v$librarycache
Where namespace in
('SQL AREA', 'TABLE/PROCEDURE', 'BODY', 'TRIGGER');

The hit ratio should be at least 85% (i.e. 0.85). The reload percent should be very low, 2% (i.e. 0.02) or less. If this is not the case, increase the initialisation parameter SHARED_POOL_SIZE. Although less likely, the init.ora parameter OPEN_CURSORS may also need to increased

3. Tuning the log buffer

To tune the value for LOG_BUFFER first determine the space request ratio, this is the ratio of redo log space requests to redo log requests:

Select Round(e.value/s.value,5) "Redo Log Ratio"
From v$sysstat s, v$sysstat e
Where s.name = 'redo log space requests'
and e.name = 'redo entries';

If the ratio of "redo log space requests" to "redo entries" is less than 5000:1 (i.e. less than 5000 in the above), then increase the size of the redo log buffer until the space request ratio stops falling.
Alternately, if memory is not a constraint then try to reduce the number of times that a process had to wait for the log cache to be flushed:

Select name, value from v$sysstat
Where name = 'redo log space requests';

The number of waits should always be zero. If not, increase the size of LOG_BUFFER, until the number returns to zero. Typically, there is no advantage in setting this beyond 1M.
If you want to know how long processes had to wait as well as the number of times then try the following script instead:

Select name, value from v$sysstat
Where name in ('redo log space requests', 'redo log space wait time');

This shows the time in units of 10 milliseconds. Be ware that because of the time granularity, 'redo log space requests' may be greater than zero whilst 'redo log space wait time' is zero. This happens if none of the waits were for 10ms or longer. Unless you have a busy server having 'redo log space wait time' of (or near) zero may indicate an acceptable level of tuning.

4. Tuning the buffer cache hit ratio

select 100*(1 - (v3.value / (v1.value + v2.value))) "Cache Hit Ratio [%]"
from v$sysstat v1, v$sysstat v2, v$sysstat v3
where
v1.name = 'db block gets' and
v2.name = 'consistent gets' and
v3.name = 'physical reads';

If the cache-hit ratio goes below 90% then:
  • For Oracle 8 and earlier: increase the initialisation parameter DB_BLOCK_BUFFERS.
  • For Oracle 9 onwards: increate the initialisation parameter DB_CACHE_SIZE.
5. Tuning sorts

Select name, value from v$sysstat
where name in ('sorts (memory)', 'sorts (disk)');

If a large number of sorts require I/O to disk, increase the initialisation parameter SORT_AREA_SIZE. As a guide less than 1% of the sorts being to disk is optimum.
If more than 1% of sorts are to disk then increase SORT_AREA_SIZE and then restart Oracle.

6. Tuning rollback segments

To identify contention for rollback segments first find out the number of times that processes had to wait for the rollback segment header and blocks. The V$WAITSTAT view contains this information:

select class, count from v$waitstat
where class in ('system undo header', 'system undo block', 'undo header', 'undo block');

The number of waits for any class should be compared with the number of logical reads over the same period of time. This information can be found in V$SYSSTAT:

select sum(value) from v$sysstat
where name in ('db block gets', 'consistent gets');

If the number of waits for any class of waits is greater than 1% of the total number of logical reads then add more rollback segments.
The following query gives the percentage of times that a request for data resulted in a wait for a rollback segment:

select round(sum(waits)/sum(gets),2) from v$rollstat;

If the percentage is greater than 1% then create more rollback segments.
Rollback segments should be isolated as much as possible by placing them in their own tablespace, preferably on a separate disk from other active tablespaces. The OPTIMAL parameter is used to cause rollback segments to shrink back to an optimal size after they have dynamically extended. The V$ROLLSTAT table can help in determining proper sizing of rollback segments:

Select segment_name, shrinks, aveshrink, aveactive "Avg.Active"
from v$rollstat v, dba_rollback_segs d
where v.usn = d.segment_id;

The following table shows how to interpret these results:
Cumulative number of shrinks
Average size of shrink
Recommendation
Low
Low
If the value for “Avg.Active” is close to OPTIMAL, the settings are correct. If not, then OPTIMAL is too large.
(Note: Be aware that it is sometimes better to have a larger optimal value - depending on the nature of the applications running, reducing it towards “Avg.Active” may cause some applications to start experiencing ORA-01555.)
Low
High
Excellent – few, large shrinks.
High
Low
Too many shrinks – OPTIMAL is too small.
High
High
Increase OPTIMAL until the number of shrinks is lower.


Continue to Part 2 for more information... Refer http://oraclemamukutti.blogspot.com/2011/03/performance-tuning-part-2.html 

Rebuild an index

The simplest way to rebuild an index is:

Alter index <index-name> rebuild tablespace <index-tablespace>;

This also has the advantage of not preventing the index from being used whilst it is being rebuilt. The tablespace must be specified otherwise the index will be rebuilt in the current users default tablespace.
Rebuilding the index also allows new storage parameters to be assigned to the index.
If the index is corrupt, it must be dropped and recreated.
  1. Firstly, identify the original creation parameters:
SELECT COLUMN_NAME FROM USER_IND_COLUMNS
WHERE INDEX_NAME = 'index_name';

SELECT TABLE_NAME, UNIQUENESS, TABLESPACE_NAME,INITIAL_EXENT, NEXT_EXTENT, MIN_EXTENTS, MAX_EXTENTS,PCT_INCREASE, PCT_FREE
FROM USER_INDEXES WHERE INDEX_NAME = 'index_name';


The above will give you the columns on which the index is based.
  1. And then drop the index and recreate it:
Drop index <index-name>;

Create [UNIQUE] index <index-name>
On <table-name>
( <column-1> [ , <column-n> ] )
tablespace <tablespace>
PCTFREE <pct-free>
STORAGE (
NEXT <size>K
INITIAL <size>K
PCTINCREASE <pct_increase>
MIN_EXTENTS <min_extents>
MAX_EXTENTS <max_extents> );

Note:
1. In order to reduce the number of extents, when recreating the index it would be advisable to set the initial extent to the current index size. The current index size can be found by:
Select sum(bytes) from dba_extents
where segment_name=’<index-name>’;
2. Alternately see Obtain information about an index for a way of determining the exact index size.
3. The primary key cannot be dropped or recreated in this way.
-------------------------------------------------------------------------------------------------------------
Obtain information about an index
General details about the index can also be found by:

Analyze index <index-name> compute statistics;Select * from user_indexes
where index_name= ‘<index-name>’;

 To obtain further detail about an index:

Analyze index <index-name> validate structure;
The command:
Validate index <index-name>; 
performs the same function.

This places detailed information about the index in the table INDEX_STATS. This table can only contain one row, describing only the one index. This SQL also verifies the integrity of each data block in the index and checks for block corruption.

For example, to get the size of an index:
validate index <index_name>;

select name "INDEX NAME", blocks * 8192 "BYTES ALLOCATED",
btree_space "BYTES USED",
(btree_space / (blocks * 8192))*100 "PERCENT USED"
from index_stats;

 This assumes a block size of 8K (i.e. 8192 bytes). It shows the number of bytes allocated to the index and the number of bytes actually used.
Note that it does not confirm that each row in the table has an index entry or that each index entry points to a row in the table. To check this:

Analyze table <table-name> validate structure cascade;
-------------------------------------------------------------------------------------------------------------
 Rebuilding indexes

Periodically, and typically after large deletes or inserts, it is worth rebuilding indexes. The SQL for this is:

Alter index <index_name> rebuild;Alternatively, the following performs the same, but avoids writing to the redo logs and thus speeds up the index rebuild:

Alter index <index_name> rebuild unrecoverable;Note: If performing this under Oracle 7.3 then be sure to specify the destination tablespace, ie:

Alter index <index_name> rebuild tablespace <tablespace>;
Otherwise the index will be moved to the temporary tablespace.